Racial/Ethnic Inequality in Educational Attainment and Occupational Status | ||||
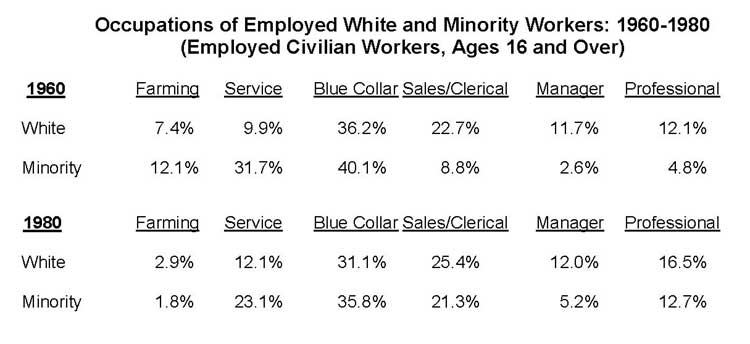
| The two tables below show the consequences of racial segregation for educational attainment and occupational status in 1960. The legacy of the "Jim Crow Era" is apparent in the fact that over 90 percent of adult African Americans in 1960 had no more than a high school education. Similarly, minority workers--primarily African Americans--were heavily concentrated in low-paying jobs in farming, service, and blue collar sectors. Data on educational attainment for Hispanic adults were not available for 1960. These tables also document the improvement in educational and occupational status for African Americans and other minorities during the subsequent two decades. Racial and ethnic inequality declined substantially by the 1980s as a result of desegregation, civil rights legislation, and other social policies that opened up new opportunities for minority students and workers in the U.S. |
|
Educational
Attainment for Adults 25 Years and Over |
||||
|
Elementary |
High School
|
Some College
|
College
Grad |
|
| 1960 |
(8 yrs
or less) |
(1-4 yrs)
|
(1-3 yrs) |
(4 yrs
or more) |
|
White |
37.6% |
45.1% |
9.3% |
8.1% |
|
Black |
60.9% |
31.9% |
4.1% |
3.1% |
|
Elementary |
High School
|
Some College
|
College
Grad |
|
|
1980 |
(8 yrs
or less) |
(1-4 yrs)
|
(1-3 yrs) |
(4 yrs
or more) |
|
White |
16.1% |
50.3% |
16.0% |
17.1% |
|
Black |
27.0% |
51.1% |
13.5% |
8.4% |
|
Hispanic |
40.2% |
40.2% |
12.0% |
7.6% |
|
|
||||
|
Elementary |
High School
|
Some College
|
College
Grad |
|
|
1989 |
(8 yrs
or less) |
(1-4 yrs)
|
(1-3 yrs) |
(4 yrs
or more) |
|
White |
10.7% |
49.9% |
17.5% |
21.8% |
|
Black |
17.3% |
54.6% |
16.3% |
11.8% |
|
Hispanic |
34.4% |
42.6% |
13.2% |
9.9% |
 |
||||
The following table presents data from the 2005 American Community Survey, which is based on a large, representative sample of the U.S. Population. This bar graph shows the continuing inequality by race and ethnicity in the U.S. in educational attainment, income, and other measures of social stratification. A brief newspaper article discussing these results is available here in pdf format (Tallahassee Democrat, Nov. 14, 2006, p. 3A).
Source: U.S. Census Bureau |
| Source: Statistical Abstract of the United States | Index Page |